


[Ed. note: Last week we ran two posts here ranking active NFL QBs by their number of good games and bad games. As a key metric we used ESPN’s proprietary Total QBR, which prompted some comments about how the classic passer rating might be a more appropriate and transparent metric to use, also because it explicitly omits a QB’s running game. This post addresses that.]
Dak Prescott’s Wikipedia page contains an entire subsection dedicated to the NFL records he set in his rookie season. Those records include the rookie record for wins (13), the rookie passer rating record (104.3), the rookie completion percentage record (67.8%), and many others – and that’s not even counting the many Cowboys franchise records he broke.
But the one record that stood out to me is the first one listed:
Prescott finished his 2016 rookie regular season with a record 11 games with an over 100 NFL passer rating, breaking the rookie record of 9 games set by Russell Wilson in 2012.
11 games with a 100+ NFL passer rating is a feat that had previously only been surpassed five times in NFL history:
1994: Steve Young (12 games)
2010: Tom Brady (12)
2011: Aaron Rodgers (13)
2011: Tom Brady (12)
2016: Matt Ryan (12)
When the NFL passer rating (not to be confused with ESPN’s QBR) was initially developed in 1973, the objective was to create a single number that would differentiate between outstanding, excellent, average, and poor performances. Below are the metrics that the developers of the formula felt best denoted those performances, and which they combined into the passer rating we know today.
| Completion Percentage |
Yards per Attempt |
Touchdown Percentage |
Interception Percentage |
Passer Rating |
|
| Outstanding | 70% | 11.0 | 10% | 1.5% | 133.3 |
| Excellent | 60% | 9.0 | 7.5% | 3.5% | 100.0 |
| Average | 50% | 7.0 | 5% | 5.5% | 66.7 |
| Poor | 30% | 3.0 | 0% | 9.5% | 0.0 |
In 1973, a passer rating of 66.7 was considered average, which was slightly above the league average passer rating of 61.7 at the time. 53 years later, the NFL average has improved by a staggering 30 points. In 2025, the NFL average passer rating was 91.4, and a 66.7 passer rating today would be considered a “poor” game by a QB. In 1973, a rating of exactly 100.0 was considered an “excellent” game, and while in today’s pass-happy NFL a passer rating of 100.0 may not be considered “excellent” anymore, it is still a pretty good performance any way you look at it.
Last year, for example, NFL QBs combined for 199 games with a passer rating over 100 in 544 opportunities. Pro-Football-Reference.com shows that there are 77 active QBs in the NFL today who have thrown for a 100+ passer rating at least once in their career. The combined W/L record of those QBs in games with a 100+ rating is 1,377-411-6 for an impressive .768 winning percentage.
Simply put, the higher your passer rating, the more you’re putting your team in a position to succeed. If we slot last year’s 544 games by passer rating tiers, these are the W/L records for each tier:
- Outstanding (>133): .897 (35-4)
- Excellent (>100): 0.729 (147-54-2)
- Average (66.7-99.9): 0.423 (104-142)
- Poor (<66.7): 0.211 (20-75)
If we accept that a 100+ rating in a game is a “good” performance by the QB, it follows that a QB with a lot of 100+ rating games is a good, perhaps even excellent, quarterback.
And with all that out of the way, here’s a look at 35 active NFL QBs with at least 20 starts along with their “good game percentage” as well as 19 retired QBs for reference. We’ll look at the QBs with fewer than 20 starts a little further down this post.
| Player | 2026 team | Games started | Good games (>100 passer rating) |
Good games (in%) | Z-score |
| Brock Purdy | SF | 45 | 25 | 55.6% | 1.7 |
| Drake Maye | NE | 27 | 15 | 55.6% | 1.7 |
| Aaron Rodgers | PIT | 253 | 133 | 52.6% | 1.3 |
| Joe Burrow | CIN | 77 | 40 | 51.9% | 1.3 |
| Dak Prescott | DAL | 138 | 71 | 51.4% | 1.2 |
| Tony Romo (ret.) | 06-16 | 125 | 64 | 51.2% | 1.2 |
| Russell Wilson (ret.) | 12-25 | 202 | 102 | 50.5% | 1.1 |
| Jordan Love | GB | 48 | 24 | 50.0% | 1.1 |
| Patrick Mahomes | KC | 126 | 62 | 49.2% | 1.0 |
| Drew Brees (ret.) | 02-20 | 283 | 139 | 49.1% | 1.0 |
| Deshaun Watson | CLE | 71 | 34 | 47.9% | 0.8 |
| Josh Allen | BUF | 124 | 59 | 47.6% | 0.8 |
| Tom Brady (ret.) | 01-22 | 332 | 156 | 47.0% | 0.7 |
| Kirk Cousins | LV | 167 | 77 | 46.1% | 0.6 |
| Lamar Jackson | BAL | 105 | 48 | 45.7% | 0.6 |
| Jared Goff | DET | 151 | 69 | 45.7% | 0.6 |
| Philip Rivers (ret.) | 06-25 | 243 | 110 | 45.3% | 0.6 |
| Justin Herbert | LAC | 95 | 43 | 45.3% | 0.6 |
| Jalen Hurts | PHI | 81 | 35 | 43.2% | 0.3 |
| Tua Tagovailoa | ATL | 75 | 32 | 42.7% | 0.3 |
| Peyton Manning (ret.) | 98-15 | 262 | 111 | 42.4% | 0.3 |
| Matt Ryan (ret.) | 08-22 | 232 | 96 | 41.4% | 0.1 |
| Ben Roethlisberger (ret.) | 04-21 | 247 | 101 | 40.9% | 0.1 |
| Matthew Stafford | LAR | 238 | 96 | 40.3% | 0.0 |
| Jameis Winston | NYG | 89 | 34 | 38.2% | -0.2 |
| Sam Darnold | SEA | 90 | 33 | 36.7% | -0.4 |
| Daniel Jones | IND | 80 | 29 | 36.3% | -0.4 |
| CJ Stroud | HOU | 45 | 16 | 35.6% | -0.5 |
| Andy Dalton | PHI | 168 | 59 | 35.1% | -0.5 |
| Jayden Daniels | WAS | 23 | 8 | 34.8% | -0.6 |
| Carson Palmer (ret.) | 04-17 | 179 | 62 | 34.6% | -0.6 |
| Cam Newton (ret.) | 11-21 | 144 | 49 | 34.0% | -0.6 |
| Ryan Tannehill (ret.) | 12-23 | 150 | 51 | 34.0% | -0.6 |
| Carson Wentz | MIN | 99 | 33 | 33.3% | -0.7 |
| Caleb Williams | CHI | 34 | 11 | 32.4% | -0.8 |
| Marcus Mariota | WAS | 81 | 26 | 32.1% | -0.8 |
| Baker Mayfield | TB | 120 | 38 | 31.7% | -0.9 |
| Kyler Murray | MIN | 86 | 27 | 31.4% | -0.9 |
| Trevor Lawrence | JAX | 77 | 24 | 31.2% | -0.9 |
| Andrew Luck (ret.) | 12-18 | 86 | 26 | 30.2% | -1.0 |
| Bo Nix | DEN | 34 | 10 | 29.4% | -1.1 |
| Robert Griffin (ret.) | 12-20 | 41 | 12 | 29.3% | -1.1 |
| Geno Smith | NYJ | 96 | 28 | 29.2% | -1.2 |
| Mac Jones | SF | 55 | 16 | 29.1% | -1.2 |
| Donovan McNabb (ret.) | 99-11 | 159 | 46 | 28.9% | -1.2 |
| Joe Flacco | CIN | 200 | 57 | 28.5% | -1.2 |
| Jay Cutler (ret.) | 06-17 | 149 | 42 | 28.2% | -1.3 |
| Nick Foles (ret.) | 12-22 | 57 | 16 | 28.1% | -1.3 |
| Sam Bradford (ret.) | 10-18 | 83 | 23 | 27.7% | -1.3 |
| Eli Manning (ret.) | 04-19 | 234 | 64 | 27.4% | -1.3 |
| Michael Vick (ret.) | 01-15 | 108 | 29 | 26.9% | -1.4 |
| Jacoby Brissett | ARI | 64 | 14 | 21.9% | -1.9 |
| Mark Sanchez (ret.) | 09-18 | 72 | 15 | 20.8% | -2.0 |
| Bryce Young | CAR | 44 | 9 | 20.5% | -2.1 |
| Source: ProFootballReference.com | |||||
The Z-score, the last column in the table above, shows a player’s ranking relative to the other QBs in the table and also determines the color tiers. The average good game performance for the 54 QBs assembled in the table above is 40%, and a score of 1.0 means the player is one standard deviation better than the NFL average at the position. The 10 QBs at the top of this table (Purdy, Maye, Rodgers, Burrow, Prescott, Romo, Wilson, Love, Mahomes, Brees) are all at least one standard deviation better than the NFL average.
For a given data set, the standard deviation measures how spread out numbers are from an average value. If your set of data (e.g. NFL QBs) shows a normal distribution, then about 68 percent of NFL players are within one standard deviation of the mean, about 95 percent are within two standard deviations, and about 99.7 percent lie within three standard deviations. Such a standard deviation is best visualized in a normal distribution curve, an example of which you can see below. I’ve included 12 QBs across the entire z-score spectrum from the table to better visualize the standard deviation across this sample.

In this context its also important to recognize that there is often, but not always, a negative correlation between career length and peak performance. Four examples illustrate this point.
- Aaron Rodgers was lighting up the league with a 60.2% “good game percentage” from 2008-2014 before dropping to 39.4% between 2015-2019, and then moving back up to 51.8% from 2020-2025.
- Patrick Mahomes had a similarly strong start, collecting a 58.8% “good game percentage” from 2017-2022 before dropping to 32.6% from 2023-2025.
- Tom Brady on the other hand has been a model of consistency, recording a 47.2% “good game percentage” over the first half (2001-11) of his career, and maintaining a 46.6% value for the second half (2012-22)
- Eli Manning has been a consistent model of mediocrity, achieving a value of just 27.7% from 2004-2011, and then maintained that sub-par performance the rest of the way with 27.0% from 2012-2019.
All of this leads us to four tiers of passers, based on the z-score values:
Tier one: Peerless Passers (Blue)
The 10 QBs at the top of this table are all at least one standard deviation better than the NFL average. Three are already retired (Brees, Romo, Wilson), four are some of today’s top veterans (Rodgers, Burrow, Prescott, Mahomes), and three more would qualify as the NFL’s young guns (Purdy, Maye, Love) and their teams appear set to dominate the league for the next decade.
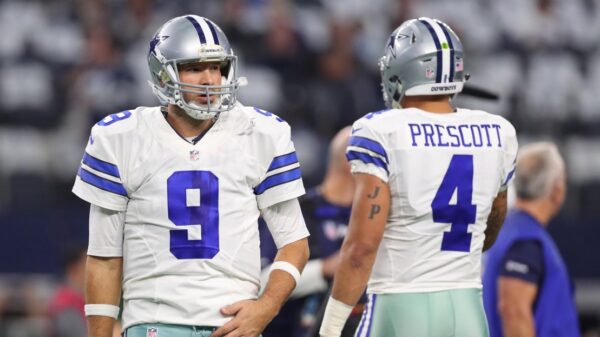
For Cowboys fans, the similarity between Romo and Prescott is almost uncanny, although they played in different eras, their good game percentage is almost identical and the two have been delivering top-tier passing performance in Dallas for two decades, even if that is not as widely recognized as it maybe should be.
Tier two: Above Average Passers (Green)
Not quite at the level of the top tier, this tier nevertheless contains some of the biggest names in the QB business with Brady, Peyton Manning, and Roethlisberger, along with some of the top current guys like Josh Allen, Lamar Jackson (who is highly-ranked even without the inclusion of his ground game), Justin Herbert, and Matthew Stafford. All are above average.
Tier three: Overrated Top Picks (Yellow)
15 QBs here rank as below average passers, and all but three of them (Daniel Jones, Andy Dalton, Ryan Tannehill) were picked within the first three picks of their respective drafts. Seven players (Jameis Winston, Carson Palmer, Cam Newton, Caleb Williams, Baker Mayfield, Kyler Murray, Trevor Lawrence) are former No.1 overall picks, four were the second overall pick (CJ Stroud, Jayden Daniels, Carson Wentz, Marcus Mariota), and one (Sam Darnold) was the third overall pick.
Their draft pedigree gets these players a lot of headlines, second, third, and even fourth chances, and their draft pedigree also means people are making a lot more excuses for their performance (“But look at the number of comeback wins,” “but look at his leadership,” “but he’s the QB of the future”, “but look at the quality of his teammates”), but as pure passers, this tier is simply not very good.
Tier four: Retired or should retire (Red)
The 15 QBs listed here are all at least one standard deviation below average. Nine of them are already retired, the rest should think about it; their performance simply doesn’t put their teams in a position to succeed often enough. And even outside of the good game percentage the six active guys in this tier all have a career passer rating below the 91.4 NFL average passer rating in 2025.
On to the mostly younger QBs with less than 20 starts. I felt that the small sample size could possibly distort the overall picture, which is why I’m listing them separately.
| Player | 2026 team | Games started | Good games (>100 passer rating) |
Good games (in%) | Z-score |
| Malik Willis | MIA | 6 | 3 | 50.0% | 1.1 |
| Tyler Shough | NO | 9 | 3 | 33.3% | -0.7 |
| Will Levis | TEN | 19 | 5 | 26.3% | -1.5 |
| Jaxson Dart | NYG | 12 | 3 | 25.0% | -1.6 |
| Michael Penix | ATL | 12 | 3 | 25.0% | -1.6 |
| Sam Howell | DAL | 18 | 4 | 22.2% | -1.9 |
| J.J. McCarthy | MIN | 10 | 2 | 20.0% | -2.1 |
| Cam Ward | TEN | 16 | 2 | 12.5% | -2.9 |
| Shedeur Sanders | CLE | 7 | 0 | 0.0% | -4.3 |
| Source: ProFootballReference.com | |||||
Tom Landry famously believed that it takes a rookie three years to fully settle into the NFL and understand the speed and complexity of the game, and that this was especially true for quarterbacks. After that, time is up, and many of the QBs listed here are fast approaching that point. Outside of Malik Willis there doesn’t seem to be a lot of upside for this group, and the Willis numbers very likely have a sample size issue.
Because there are bound to be questions about this, we’re adding an extra section today that looks only at playoff games, even if sample size issues abound and may render the entire exercise useless.
Of the 54 quarterbacks in our original panel, only five have more than 20 playoff games on their record, so that 20-game limit goes out the window. I’ve opted instead to lower the minimum playoff games to five, which still leaves us with 30 QBs to look at, but which opens us up to all sorts of sample size vagaries.
| Player | 2026 team | Playoff games started | Good games (>100 passer rating) |
Good games (in%) |
| Nick Foles (ret.) | 12-22 | 6 | 4 | 66.7% |
| Patrick Mahomes | KC | 21 | 13 | 61.9% |
| Jalen Hurts | PHI | 10 | 6 | 60.0% |
| Baker Mayfield | TB | 5 | 3 | 60.0% |
| Russell Wilson (ret.) | 12-25 | 17 | 10 | 58.8% |
| Matt Ryan (ret.) | 08-22 | 10 | 5 | 50.0% |
| Tony Romo (ret.) | 06-16 | 6 | 3 | 50.0% |
| Mark Sanchez (ret.) | 09-18 | 6 | 3 | 50.0% |
| Josh Allen | BUF | 15 | 7 | 46.7% |
| Aaron Rodgers | PIT | 22 | 10 | 45.5% |
| Eli Manning (ret.) | 04-19 | 11 | 5 | 45.5% |
| Drew Brees (ret.) | 02-20 | 18 | 8 | 44.4% |
| Joe Burrow | CIN | 7 | 3 | 42.9% |
| Cam Newton (ret.) | 11-21 | 7 | 3 | 42.9% |
| Ryan Tannehill (ret.) | 12-23 | 5 | 2 | 40.0% |
| Tom Brady (ret.) | 01-22 | 48 | 19 | 39.6% |
| Joe Flacco | CIN | 16 | 6 | 37.5% |
| Lamar Jackson | BAL | 8 | 3 | 37.5% |
| Philip Rivers (ret.) | 06-25 | 12 | 4 | 33.3% |
| Matthew Stafford | LAR | 13 | 4 | 30.8% |
| Jared Goff | DET | 10 | 3 | 30.0% |
| Dak Prescott | DAL | 7 | 2 | 28.6% |
| Peyton Manning (ret.) | 98-15 | 27 | 6 | 22.2% |
| Ben Roethlisberger (ret.) | 04-21 | 23 | 5 | 21.7% |
| Kirk Cousins | LV | 5 | 1 | 20.0% |
| Michael Vick (ret.) | 01-15 | 5 | 1 | 20.0% |
| Donovan McNabb (ret.) | 99-11 | 16 | 3 | 18.8% |
| CJ Stroud | HOU | 6 | 1 | 16.7% |
| Brock Purdy | SF | 8 | 1 | 12.5% |
| Andrew Luck (ret.) | 12-18 | 8 | 1 | 12.5% |
| Source: ProFootballReference.com | ||||
The best playoff QBs by this methodology are Nick Foles (66.7%), who rode his backup role in in 2018 all the way to a Super Bowl ring, and Jayden Daniels (66.7%, not on this list), who had two 100+ rating games in his three-game playoff run in 2024.
That’s not a ringing endorsement of this list and highlights the sample size issues here.
Also, with the sample size being what it is, the margins between the different tiers are razor thin. Case in point: Dak Prescott, whose ranking has to be a little disappointing for Cowboys fans. Prescott has one playoff game (vs. the Rams) with a passer rating of 99.2. One extra completion in that game would have pushed him above 100, and given him a good game percentage of 42.9%. One extra pass is the difference between being in the red tier or being smack in the middle of the green tier.
Similarly, Nick Foles had a playoff game with a 100.1 rating. One more incomplete pass in that game and his good game percentage drops from 66.7% to 50%, that’s how much variance is introduced through the low sample size.
But it’s also not like Prescott hasn’t come under criticism for his playoff record, but it’s worth keeping in mind that a few plays here or there can change entire career narratives, e.g how on earth can Aaron Rodgers complete a 36-yard pass on 3rd-and-20 with 12 seconds left on the clock?
Some veterans like Peyton Manning, Ben Roethlisberger, and Tom Brady don’t exactly look stellar here, but it’s worth keeping in mind that they spent parts of their career in a different NFL passing era – though that didn’t stop Tony Romo from achieving a 50% good game percentage, albeit with a much lower number of playoff games.
Over to you: More often than not, you will intuitively know whether a set of stats makes sense or not. Does this peer comparison match your gut feeling?